Debug assembly code with GDB
GDB (GNU Debugger)
A debugger like gdb and lldb is useful when debugging a program. An user can control execution of a program, see current state of a program. I usually compile a C/C++ program with debug option for debugging. Compiler debug option will generate a executable file with additional informations so that debugger can give more informations to user. If such informations are not included in the executable, user may need to debug it with register values and assembly codes.
GDB commands
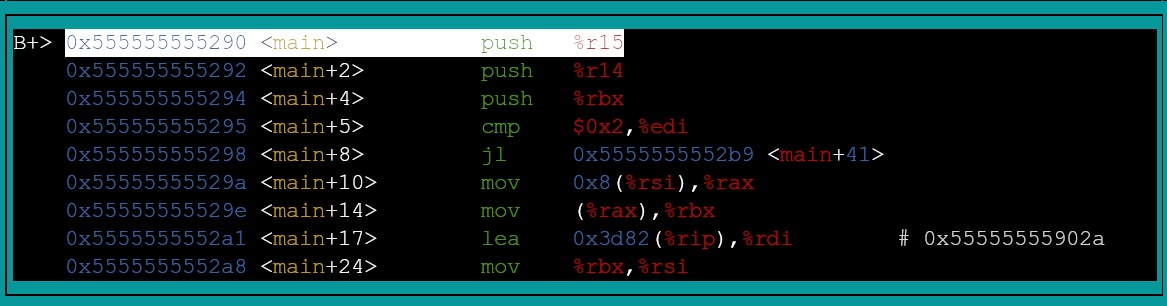
assembly view
layout asm
This command enables assembly view. If the executable has debug information, use layout src to enable source view.
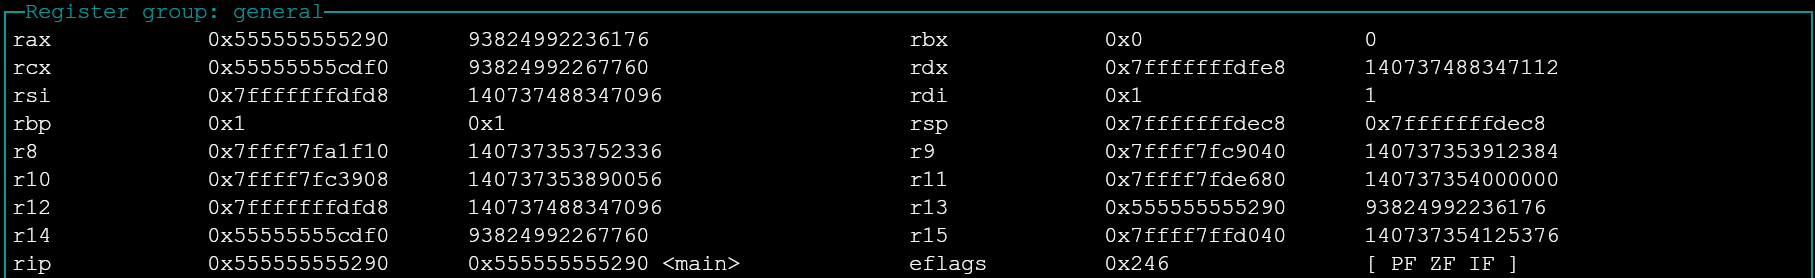
register values
layout reg
This command enables register view. What registers will be displayed in the view varies by window size.
next instruction
nexti, ni
Use those to execute one instruction and move cursor to the next instruction. Cursor points to an assembly line that located at the value of RIP, called instruction pointer or program counter.
Before
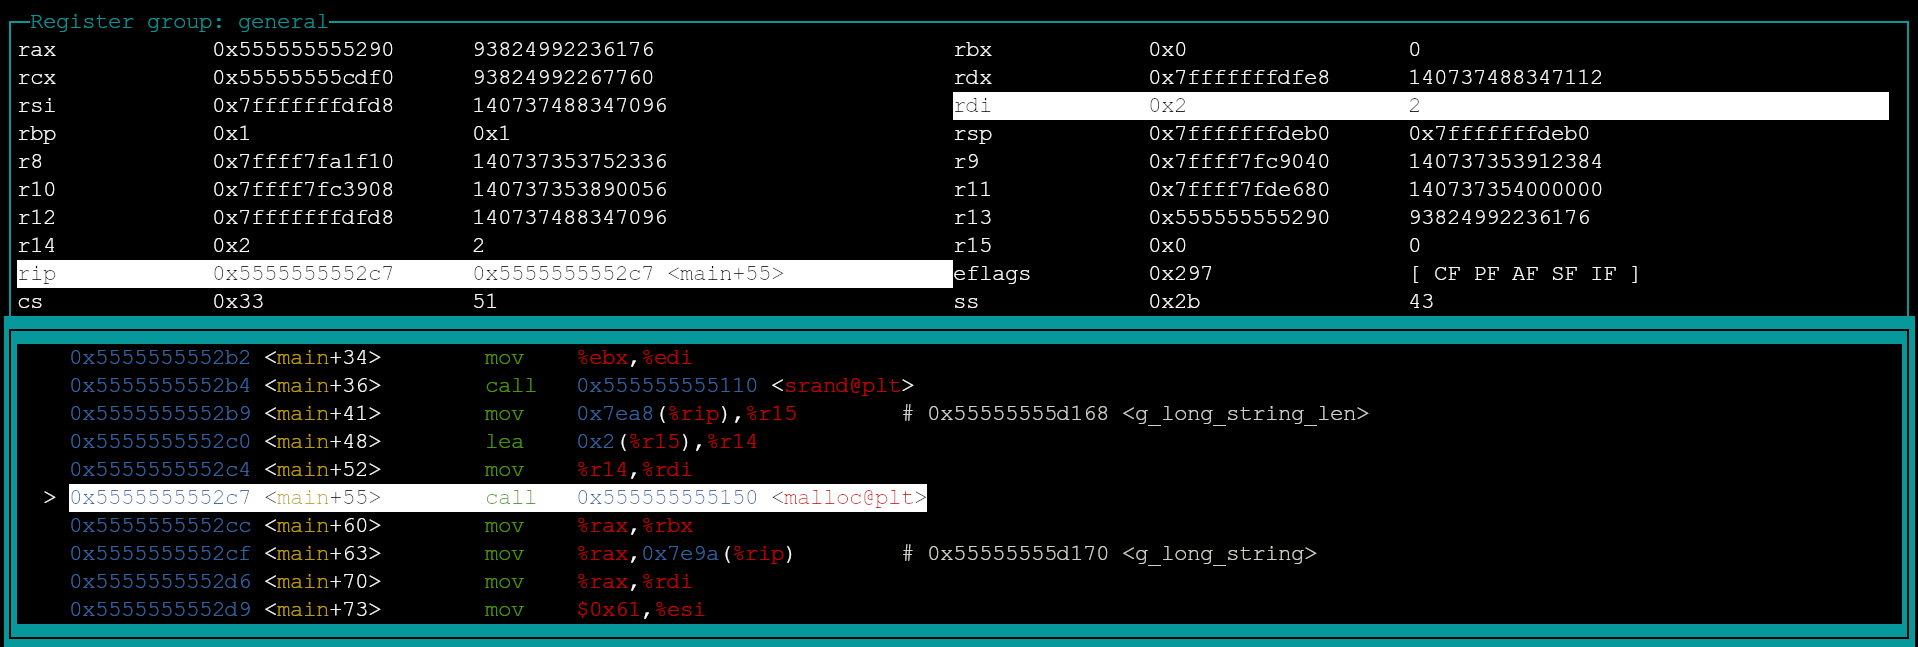
RIP = 0x5555555552c7
After
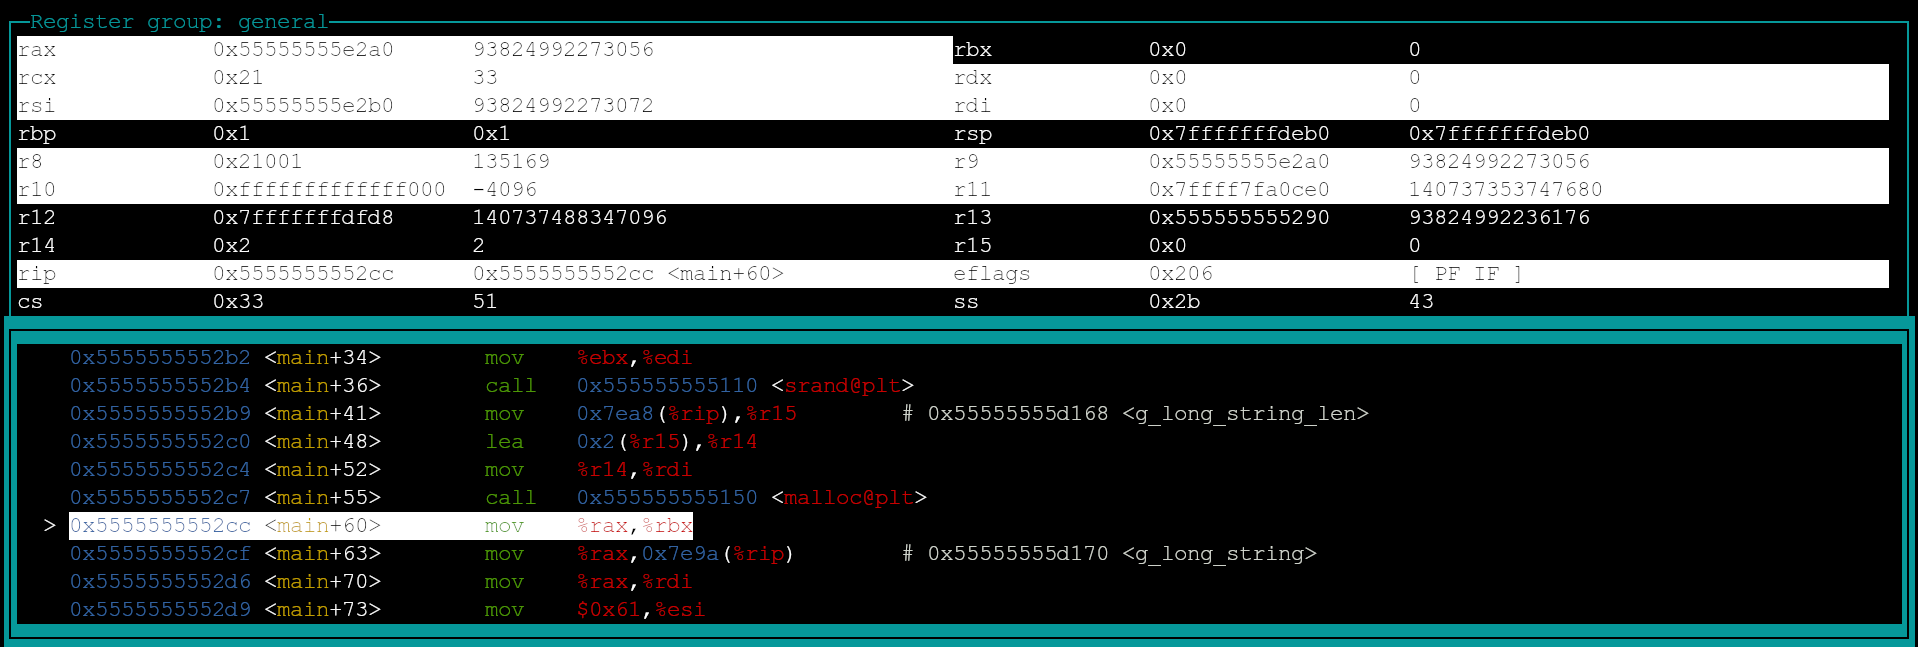
RIP = 0x5555555552cc, cursor moved to next instruction and some registers have changed as a result of a subroutine call.
step into subroutine calls
stepi, si
If the next instruction is a subroutine call, stepi and si commands will move the cursor into the call.
After
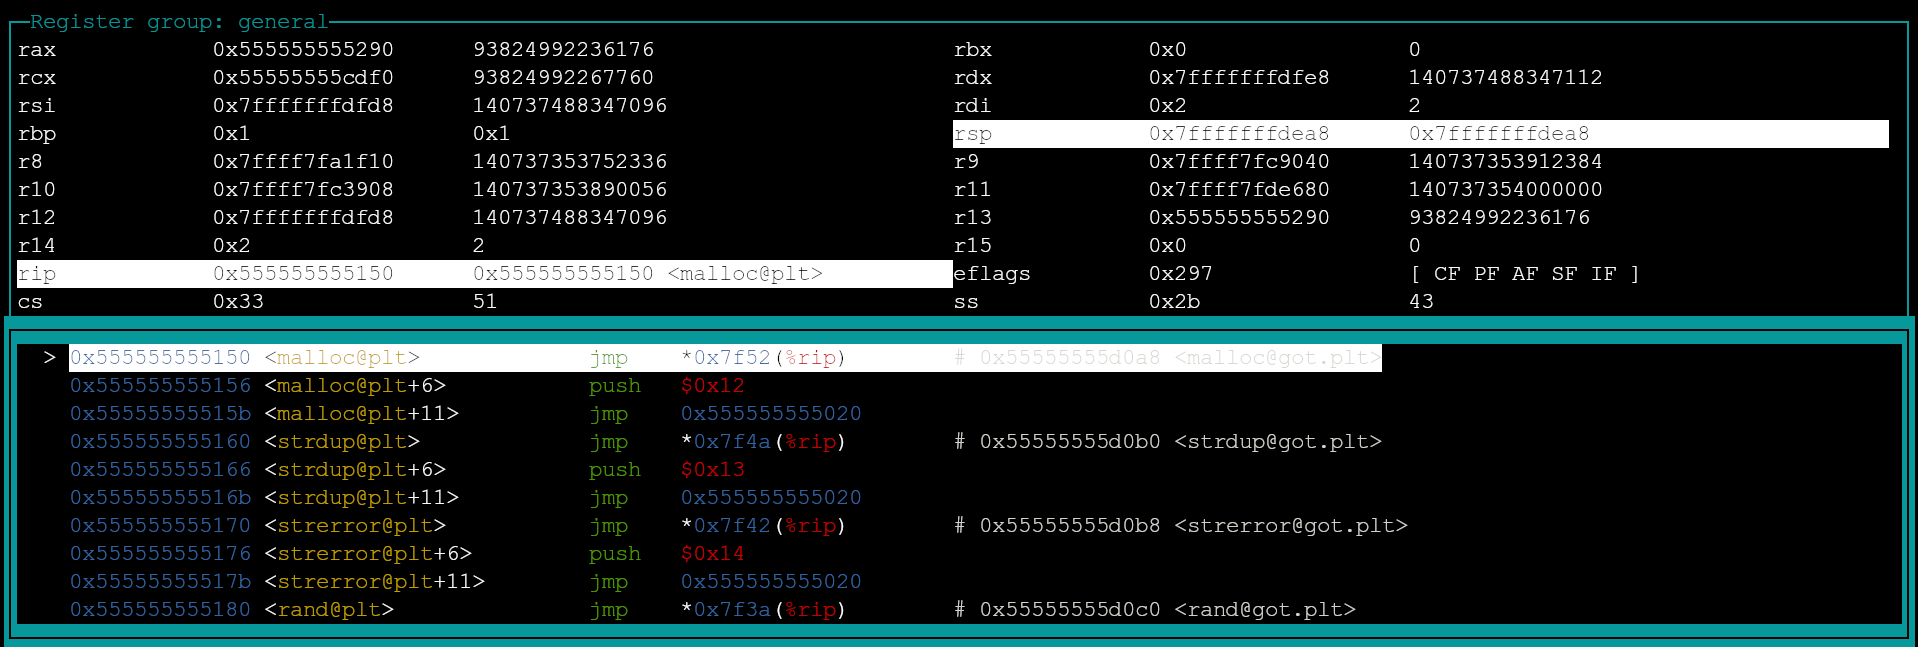
RIP = 0x555555555150, cursor moved to an entry of procedure linkage table, malloc@plt.